Why Tableau is Popular Among Data Analysts
In today’s data-driven business environment, organizations rely heavily on analytics to improve decision-making, monitor performance, and identify growth opportunities. As businesses generate increasingly large and complex datasets, the demand for powerful data visualization and business intelligence tools continues growing rapidly.
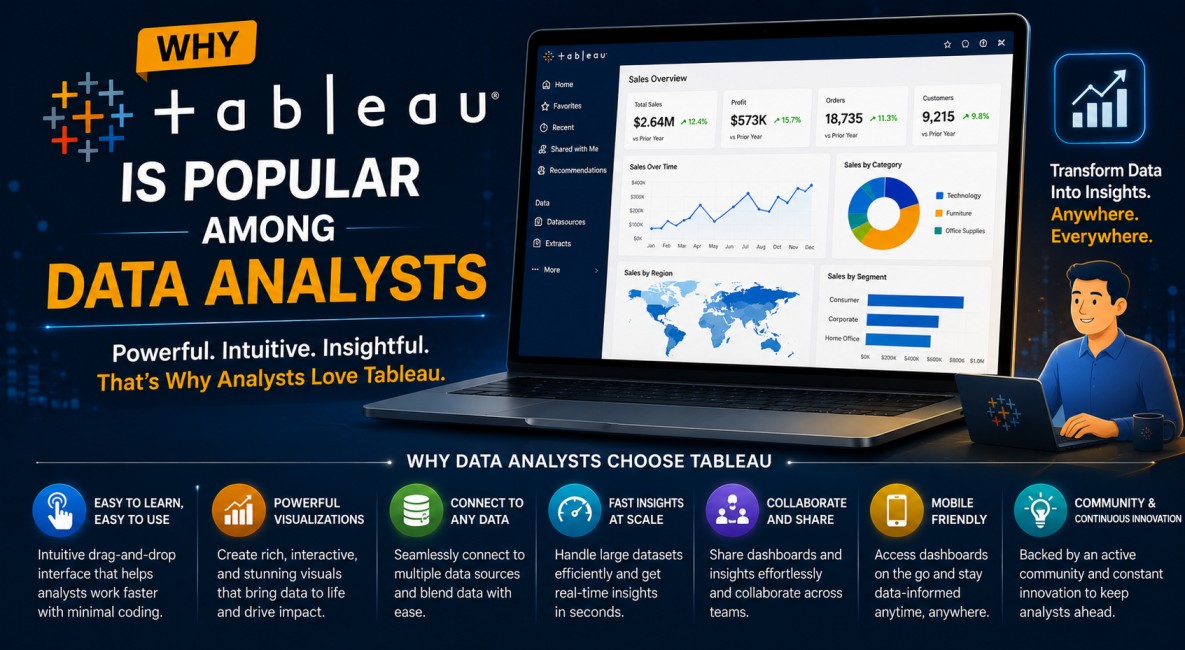
Among the many analytics platforms available, Tableau has become one of the most preferred tools among data analysts worldwide.
From startups to multinational enterprises, data analysts use Tableau to:
- Visualize complex datasets
- Build interactive dashboards
- Identify business trends
- Perform real-time analysis
- Simplify reporting workflows
- Communicate insights effectively
Its combination of advanced visualization capabilities, user-friendly interface, and enterprise scalability has made Tableau a dominant platform in modern analytics ecosystems.
At KnexBI, organizations increasingly implement Tableau dashboards and analytics systems to empower data analysts with faster reporting, scalable visual intelligence, and more efficient business decision-making.
In this article, we’ll explore why Tableau is so popular among data analysts and how it continues shaping the future of business intelligence in 2026 and beyond.
The Growing Role of Data Analysts in Modern Businesses
Before understanding Tableau’s popularity, it’s important to recognize the expanding role of data analysts in modern organizations.
Today’s analysts are expected to:
- Process massive datasets
- Discover business insights
- Track KPIs
- Build dashboards
- Support strategic decisions
- Present data visually
- Deliver real-time intelligence
Businesses no longer want static spreadsheets or manual reporting processes. Instead, modern organizations now demand interactive analytics, automated reporting, real-time dashboards, self-service BI, and predictive insights.
This shift has increased the importance of tools that simplify data exploration and visualization. Tableau has become highly popular because it directly addresses these modern analytics needs.
1. Tableau Makes Data Visualization Simple
One of the biggest reasons data analysts prefer Tableau is its exceptional data visualization capability. Traditional spreadsheets often make it difficult to identify patterns, trends, and anomalies in large datasets.
Tableau transforms raw data into:
- Interactive charts
- Dynamic dashboards
- Heat maps
- Geographic visualizations
- Trend analysis reports
- KPI scorecards
These visualizations help analysts communicate insights more effectively to stakeholders and leadership teams. Instead of reviewing rows of numbers, decision-makers can quickly understand business performance through intuitive dashboards. This ability to simplify complex analytics is one of Tableau’s greatest strengths.
2. Drag-and-Drop Interface Improves Productivity
Tableau is widely known for its user-friendly drag-and-drop interface. Data analysts can build dashboards quickly, create visualizations without coding, modify reports easily, and explore data interactively.
This significantly reduces development time compared to traditional reporting tools. Even analysts with limited programming experience can create advanced visualizations efficiently. The simplified workflow allows analysts to focus more on insight generation, business analysis, and data storytelling rather than spending excessive time on technical report development.
3. Tableau Supports Multiple Data Sources
Modern organizations store data across multiple platforms, including databases, cloud applications, CRM systems, ERP platforms, Excel files, marketing tools, and SQL environments. Tableau supports integration with a wide range of these sources.
Analysts can connect Tableau with:
- Microsoft Excel
- Google BigQuery
- Snowflake
- Microsoft SQL Server
- Google Analytics
- Cloud storage systems
- APIs
- Enterprise databases
This flexibility allows analysts to centralize reporting and unify analytics workflows seamlessly across the enterprise.
4. Real-Time Analytics Capabilities
Businesses increasingly require real-time operational visibility. Tableau enables analysts to build dashboards that update dynamically as data changes.
Real-time analytics helps organizations:
- Monitor operations continuously
- Detect issues faster
- Track live KPIs
- Respond quickly to changing business conditions
Industries such as ecommerce, finance, logistics, healthcare, and manufacturing especially benefit from real-time dashboard capabilities. Data analysts value Tableau because it supports faster operational intelligence.
5. Strong Data Exploration Features
Data analysts often need to explore datasets deeply before identifying actionable insights. Tableau provides robust interactive exploration capabilities.
Key features include:
- Filtering and cross-filtering
- Drill-down analysis
- Dynamic parameters
- Interactive dashboards
- Data highlighting
These tools help analysts investigate trends and anomalies more efficiently. Instead of creating multiple static reports, analysts can interact with live dashboards dynamically, improving analytical flexibility significantly.
6. Tableau Enhances Data Storytelling
One of the most important responsibilities of analysts is communicating insights clearly. Data alone rarely influences decisions unless stakeholders understand the business story behind it.
Tableau supports strong data storytelling through:
- Interactive visual narratives
- Optimized dashboard layouts
- Presentation-ready visuals
- Dynamic reporting environments
Analysts can seamlessly combine KPIs, charts, filters, and explanatory insights into unified business stories. This directly helps executives and teams understand complex analytics more effectively.
7. Self-Service Analytics Reduces IT Dependency
Traditional reporting environments often required heavy IT involvement for every dashboard or report update. Tableau’s self-service analytics capabilities break this bottleneck.
Analysts can:
- Create reports independently
- Modify dashboards quickly
- Explore data without developer support
This independence improves operational agility, reporting speed, and analytics accessibility. Organizations increasingly prefer self-service BI because it accelerates decision-making across departments.
8. Tableau Handles Large Datasets Efficiently
Modern analytics environments often involve millions of records. Tableau is specifically designed to process and visualize large datasets efficiently when optimized correctly.
Analysts working with enterprise-scale analytics appreciate Tableau’s ability to:
- Query large database infrastructures
- Handle highly complex visualizations
- Support scalable, reliable dashboards
- Integrate with modern cloud data warehouses
This backend performance and scalability make Tableau highly suitable for the most demanding enterprise reporting environments.
9. Tableau Supports Advanced Analytics
Beyond basic visualization, Tableau also supports advanced analytical workflows. Analysts can tap into native capabilities to perform forecasting, trend analysis, predictive modeling, statistical testing, and time-series analysis.
These capabilities help businesses move beyond descriptive reporting ("what happened") and step into predictive intelligence ("what might happen next"), significantly boosting strategic planning effectiveness.
10. Strong Community and Learning Resources
Another major reason Tableau is popular among analysts is its massive, passionate global community. This ecosystem provides a wealth of learning resources, including step-by-step tutorials, online forums, structured training courses, community dashboards (like Tableau Public), and knowledge-sharing platforms. This vibrant network makes learning Tableau easier for beginners and advanced professionals alike.
11. Tableau Improves Executive Reporting
Executives require clean, high-impact dashboards that simplify business performance into easily understandable visuals. Tableau helps analysts construct dedicated executive KPI dashboards, strategic reporting systems, and leadership analytics portals. By cutting out the noise, these layouts improve communication between analysts and leadership teams.
12. Cloud Analytics Adoption is Increasing Tableau Usage
As cloud-based analytics adoption continues growing rapidly, Tableau has kept pace by expanding its cloud-native offerings. Supporting secure cloud deployments, remote asynchronous collaboration, and web-based dashboard modifications, the platform makes it straightforward for organizations to scale business intelligence across global, distributed teams.
13. Tableau Supports Cross-Department Analytics
Data analysts often find themselves working cross-functionally across multiple departments, such as marketing, finance, sales, HR, and operations. Tableau allows organizations to centralize data reporting models while still supporting department-specific visual layouts. This alignment improves collaboration, ensures reporting consistency, and increases macro-level enterprise visibility.
14. Tableau is Widely Used in Enterprise Environments
Large enterprises increasingly adopt Tableau as their core visualization layer to tackle enterprise reporting, daily operational analytics, high-level KPI tracking, data governance enforcement, and overall business intelligence modernization. Its built-in scalability makes it highly reliable when standardizing metrics across dozens of analytics teams.
15. Tableau Continues Evolving with AI and Automation
The future of analytics heavily involves AI-powered insights, automated reporting, automated data prep, and natural language querying (such as Tableau Pulse). By continuously integrating these modern technologies directly into its platform, Tableau maintains high relevance among modern data analysts who seek automated insight delivery and advanced decision-support mechanisms.
Common Challenges Analysts Face with Tableau
Despite its distinct strengths, Tableau also presents practical implementation challenges that analysts must manage.
Common hurdles include:
- Performance optimization complexity for massive datasets
- Enterprise licensing costs
- Data modeling limitations at the visualization layer
- Governance and version control management
- Dashboard sprawl and duplicated reports
Overcoming these roadblocks requires proper data architecture, proactive data quality management, comprehensive dashboard optimization, and clear governance frameworks. Ultimately, a tool is only as strong as the overarching analytics strategy supporting it.
Industries Where Tableau Analysts are in High Demand
Demand for skilled Tableau professionals continues increasing exponentially across a variety of sectors, including healthcare, finance, retail, manufacturing, ecommerce, logistics, marketing agencies, and technology enterprises. Organizations are actively looking for analysts who can bridge the gap between technical raw data and clean, actionable business intelligence.
How KnexBI Helps Businesses Build Tableau Analytics Solutions
At KnexBI, we help organizations deploy robust Tableau solutions built for enterprise reporting, real-time dashboards, operational analytics, executive KPI monitoring, and modern cloud analytics ecosystems.
KnexBI partners with businesses to:
- Optimize workbook and dashboard rendering performance
- Design scalable, logical dashboard architectures
- Build tailored, industry-specific reporting systems
- Streamline data pipelines and analytics workflows
- Modernize legacy enterprise BI environments
This hands-on methodology enables organizations to maximize their return on investment in modern business intelligence and data visualization platforms.
Future of Tableau for Data Analysts
The fundamental role of data analysts will continue to adapt as businesses become increasingly data-dependent. Future Tableau product cycles will continue to emphasize AI-assisted analytics, automated dashboard generation, predictive business intelligence, edge operational analytics, embedded dashboards, and conversational BI frameworks.
AI-Powered Tableau Reporting
Tableau has solidified its spot as a core analytics platform among data analysts because it elegantly balances powerful custom visualization, operational ease of use, enterprise scalability, and interactive, real-time dashboarding.
As modern business operations expand deeper into cloud analytics ecosystems, automated AI reporting, and fast, data-driven decision loops, Tableau remains a vital technical skill for analysts striving to turn complex raw data into transparent, actionable business assets.
