Data-driven businesses rely heavily on analytics to understand customer behavior, track marketing performance, and improve decision-making. Among the most powerful combinations for modern reporting is integrating Google Analytics 4 with Looker Studio.
By connecting GA4 to Looker Studio, businesses can transform raw analytics data into interactive dashboards, real-time reports, and actionable insights. Instead of navigating multiple analytics interfaces, organizations can centralize performance metrics into a single visual reporting environment.
From website traffic analysis and conversion tracking to marketing campaign performance and customer engagement reporting, this integration helps businesses monitor KPIs more effectively and optimize digital strategies faster.
At KnexBI, businesses increasingly implement GA4 and Looker Studio integrations to build scalable analytics dashboards and automated reporting systems.
In this guide, we’ll explain how to connect GA4 to Looker Studio step-by-step, along with best practices, optimization tips, and common troubleshooting solutions.
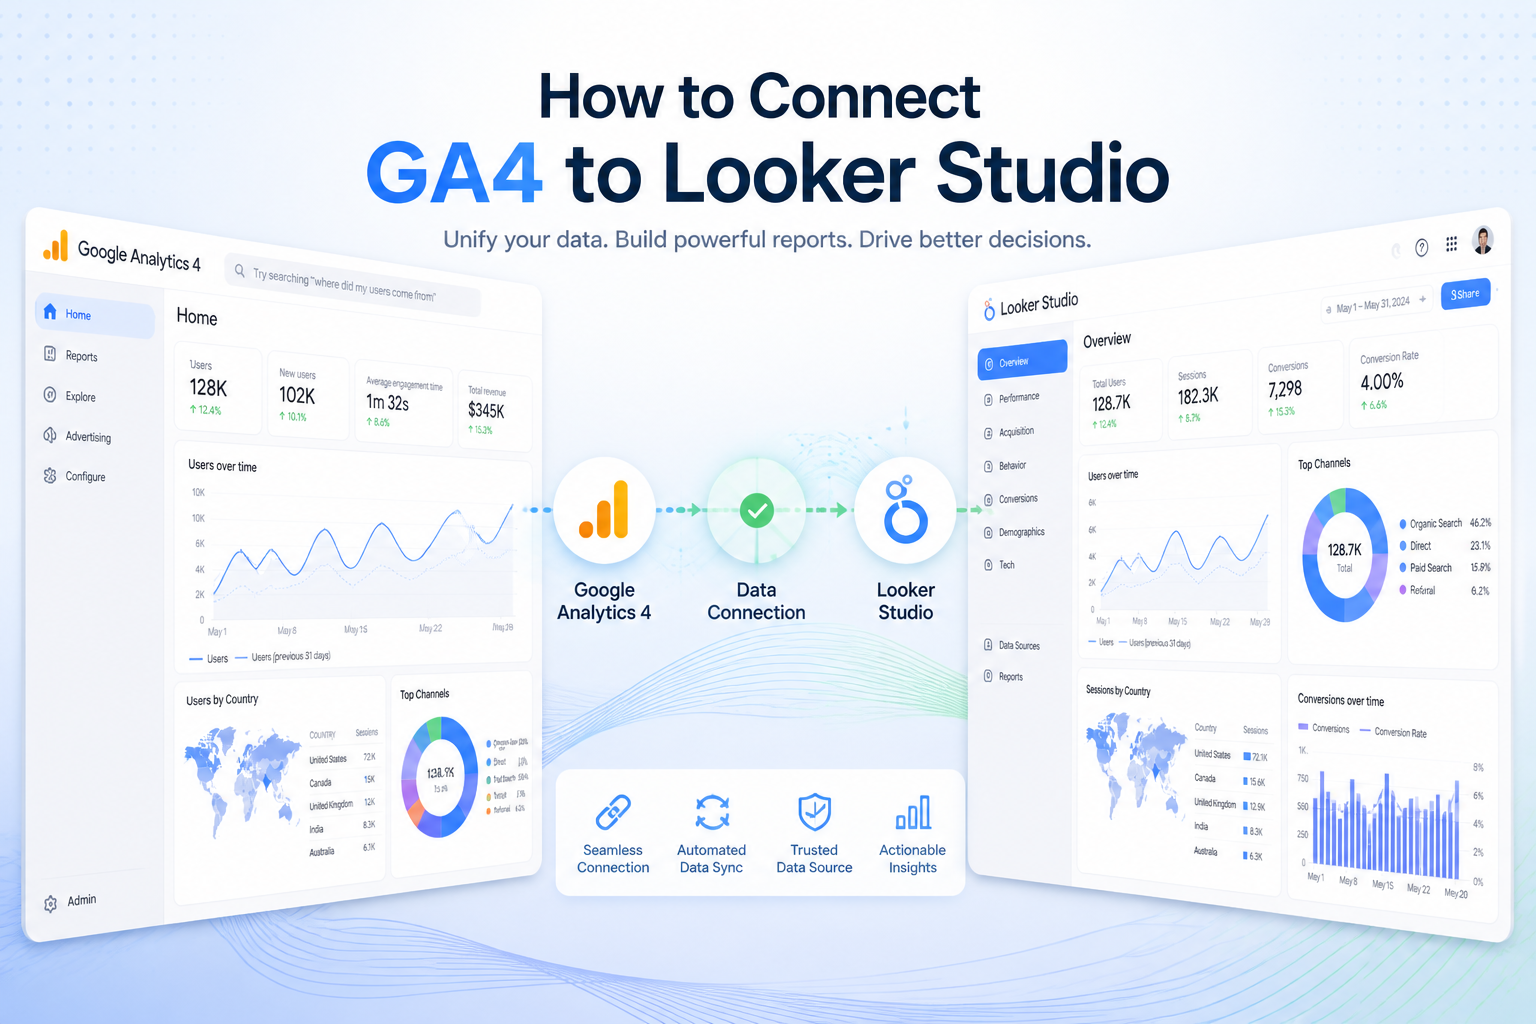
Why Connect GA4 to Looker Studio?
GA4 provides powerful analytics capabilities, but Looker Studio enhances data interpretation through advanced visualization and dashboard reporting.
Benefits of Connecting GA4 to Looker Studio
- Interactive Dashboards: Create visually engaging dashboards with charts, scorecards, maps, and KPI reports.
- Centralized Reporting: Combine GA4 data with Google Ads, Search Console, CRM platforms, SEO tools, and Ecommerce platforms into one dashboard.
- Real-Time Analytics: Monitor traffic, conversions, and campaigns in near real time.
- Automated Reporting: Reduce manual exports and automate recurring reports.
- Better Decision-Making: Visual analytics help teams identify trends and optimize marketing performance faster.
Prerequisites Before Connecting GA4 to Looker Studio
Before starting the integration process, ensure you have:
- A Google account
- Access to a GA4 property
- Appropriate GA4 permissions
- Access to Looker Studio
- Properly configured GA4 tracking
Note: Without admin or viewer access to the GA4 property, the connection may fail.
Step-by-Step Guide to Connect GA4 to Looker Studio
Step 1: Open Looker Studio
Go to the Looker Studio Official Website and log in using your Google account. After logging in, click “Blank Report” or create a new dashboard from templates. This opens the report editor where you can connect data sources.
Step 2: Add a Data Source
Once inside the report editor, click “Add Data” and select Google Analytics. Looker Studio automatically displays available GA4 properties associated with your Google account.
Step 3: Select Your GA4 Property
Choose your Account, Property, and GA4 data stream. Then click “Add”, followed by “Add to Report”. Your GA4 property is now connected successfully.
Step 4: Configure Dashboard Visualizations
After connecting the data source, you can begin building dashboards using Looker Studio's drag-and-drop functionality to create visual reports quickly.
Common GA4 Metrics to Visualize:
- Traffic Metrics: Users, Sessions, Pageviews, Engagement rate
- Marketing Metrics: Traffic sources, Campaign performance, Conversions, Cost per acquisition
- Ecommerce Metrics: Revenue, Transactions, Average order value
- User Behavior Metrics: Events, Landing pages, User retention, Bounce analysis
Step 5: Customize Your Dashboard
To improve dashboard usability, add filters, use date range controls, create interactive scorecards, add comparison charts, and apply branding styles. A clean dashboard structure improves both performance and readability.
Best Dashboard Types for GA4 Reporting
| Dashboard Type | Key Metrics & Tracked Elements |
|---|---|
| 1. SEO Performance Dashboard | Organic traffic, Landing page performance, User engagement, Traffic trends |
| 2. Marketing Campaign Dashboard | Paid campaigns, Conversion tracking, ROI metrics, Audience behavior |
| 3. Ecommerce Dashboard | Revenue, Product performance, Customer journeys, Checkout behavior |
| 4. Executive KPI Dashboard | High-level business insights and strategic business-critical metrics |
Important GA4 Metrics to Track
When creating dashboards, focus on business-critical KPIs to ensure your configurations remain actionable and business-focused.
| Traffic KPIs | Conversion KPIs | User Engagement KPIs | Acquisition KPIs |
|---|---|---|---|
|
|
|
|
Common Issues When Connecting GA4 to Looker Studio
Although the integration is generally straightforward, businesses may encounter some common troubleshooting hurdles.
| Issue | Possible Causes | Solutions & Optimization Tips |
|---|---|---|
| 1. Missing Data | Incorrect GA4 setup, delayed data processing, or tracking configuration issues. | Verify GA4 property settings, event tracking, and Google Tag Manager implementations. |
| 2. Permission Errors | Insufficient user access rights. | Ensure your Google account has Viewer, Analyst, or Admin access within the GA4 property. |
| 3. Slow Dashboard Performance | Large datasets and excessive visualization assets. | Reduce unnecessary charts, use extracted data sources, limit heavy filters, and simplify calculations. |
| 4. Data Sampling Issues | GA4 applying sampling thresholds for highly complex data queries. | Utilize BigQuery exports, simplify layouts, and reduce query complexity to maintain accuracy. |
Advanced GA4 and Looker Studio Integrations
Businesses increasingly integrate GA4 dashboards with additional platforms for cross-channel analysis, including Google Ads, Search Console, BigQuery, CRM systems, Ecommerce setups, and social media analytics markets.
Using BigQuery for Advanced GA4 Reporting
For large-scale data environments, structural data pathways move through GA4 → BigQuery → Looker Studio. This enterprise architecture offers:
- Better data architecture scalability
- Faster query processing speeds
- Historical data retention and compliance flexibility
- Advanced deep-dive SQL analytical capabilities
Best Practices for GA4 Dashboard Design
- Keep Dashboards Simple: Avoid overwhelming users with too many concurrent charts.
- Prioritize Key KPIs: Focus strictly on high-impact, actionable data metrics.
- Use Consistent Visuals: Maintain balanced colors, cohesive layouts, and structured filters.
- Optimize Performance: Reduce heavy calculated fields and excessive blended data objects.
- Enable Interactivity: Apply cross-filters and analytical drill-down controls carefully.
How KnexBI Helps Businesses Build GA4 Dashboards
At KnexBI, we design and construct customized GA4 and Looker Studio systems tailored for marketing analytics, SEO reporting, ecommerce tracking, executive dashboards, and real-time KPI monitoring ecosystems.
Our team helps your organization optimize data processing metrics, integrate diverse third-party data ecosystems, automate operational workflows, and deploy highly scalable analytics environments.
Future of GA4 Reporting in Looker Studio
Analytics reporting continues evolving rapidly with AI capabilities and native automated insights. Future operational milestones may introduce AI-generated contextual data, automated anomaly detection systems, predictive tracking metrics, and conversational intelligence capabilities to centralize metrics further into business actions.
Ready to Elevate Your Analytics Dashboard Infrastructure?
Connecting GA4 to Looker Studio is one of the most effective methods to construct highly visible and automated operational platforms. Whether you are an agile startup, agency, ecommerce brand, or complex enterprise, integrating these assets optimizes marketing returns and builds long-term performance growth in 2026 and beyond.
Contact KnexBI today to build a smarter, more intelligent data solutions landscape together.
